


Attention spans are shortening, and ad blockers are on the rise, which means it’s crucial for brands to know exactly where their money’s going.
According to media company Marketing Evolution, 60% of digital ad spend is wasted. If you’re not getting the results you want, you’re going to have a hard time justifying the ongoing costs.
If you want to continue to reap the rewards, it’s critical to demonstrate the returns you’re getting from your digital ads.
Here are six steps for building an effective approach to measuring and demonstrating high returns for your digital ad spend.
1. Set Clear Objectives and Key Performance Indicators (KPIs)
You can’t measure the performance of your digital ads if you don’t know what you’re measuring them against. Setting clear and attainable KPIs will ensure you’re working towards a clear objective and help you make strategic decisions when setting up your ad campaigns.
For best results, choose SMART goals:
- Specific
- Measurable
- Achievable
- Relevant
- Time-bound
For example, “increase click-through rate (CTR) by 5% each month” is a much clearer goal than “increase CTR.” Make sure your goals are achievable too. Otherwise, you’re setting yourself up for failure.
Analyze your previous results to see what’s possible and use those metrics to set future goals.
2. Implement Robust Analytics Tools
An analytics tool will provide all the insight you need into the performance of your ad campaigns. Google Analytics is an excellent option, as it tracks click-throughs to your website, and you can set “Event” goals that you can measure your results against.
Alternatively, you can use a third-party analytics tool, many of which come with additional features.
You’ll need to set up your analytics tool to track your campaigns, which can be a learning curve if you’re using something you’re not used to.
Spend some time getting your dashboard looking how you want so it’s easy for you to check in and monitor the success of your ads.
3. Choose the Right Attribution Model
Attribution models determine what channel you give the most weight to when it comes to tracking conversions. This is especially important online, where customers might visit three or more channels before deciding to make a purchase.
The 2 Most Common Attribution Models
The two most common attribution models are first-touch attribution and last-touch attribution.
- First-touch attribution model: First-touch attribution assigns the most value to the first touch point a customer engages with on their purchasing journey.
- Last-touch attribution model: Last-touch attribution assigns the most value to the last touch point a customer engages with before they purchase.
How Each Attribution Model Works
Let’s say a shopper found your brand via Instagram, signed up for your newsletter, and then clicked through from a Google ad to buy.
First-touch attribution would assign the most value to Instagram (because that’s how the customer found you), while the last-touch attribution model would give all the credit to the Google ad.
The problem with these two popular models is that neither accounts for any of the other touch points in the sales cycle. Neither of them assign any value to the newsletter, regardless of how much impact that had on the end sale.
4 Other Valuable Types of Attribution Models
There are four other types of attribution models that do apply value to every step in the sales cycle.
- Multi-source marketing attribution model: The multi-source marketing attribution model assigns the right amount of credit to each touch point a customer engages with, but it’s tricky to truly know how much each channel contributed to the end sale.
- Time decay attribution model: The time decay attribution model assigns more weight to touch points that were visited later in the sales cycle with the most credit assigned to the final touch point.
- Linear attribution model: The linear attribution model assigns value evenly across all touch points in the sales cycle.
- U-shaped attribution model: The u-shaped attribution model assigns 40% of the credit to the very first touch point, 40% to the last, and 20% across the other touch points a customer engages with.
The attribution model you choose will depend on your business, customers, and digital ad strategy. It’s much easier to track the final touch point than it is to assign weighted value across the entire sales cycle, especially if it’s not critical for you to know that information.
However, when it comes to justifying your ad spend, it’s important to know how much your ad campaigns contribute to sales.
4. Implement Conversion Tracking
Conversion tracking tells you which ads are generating leads and sales and are therefore your highest performers. You can use this information to pump more money into your most successful ads and alter or remove any that aren’t performing well enough.
If you’re not tracking conversions, you might struggle to accurately measure the success of any of your ads which can lead to poor assumptions — a recipe for disaster.
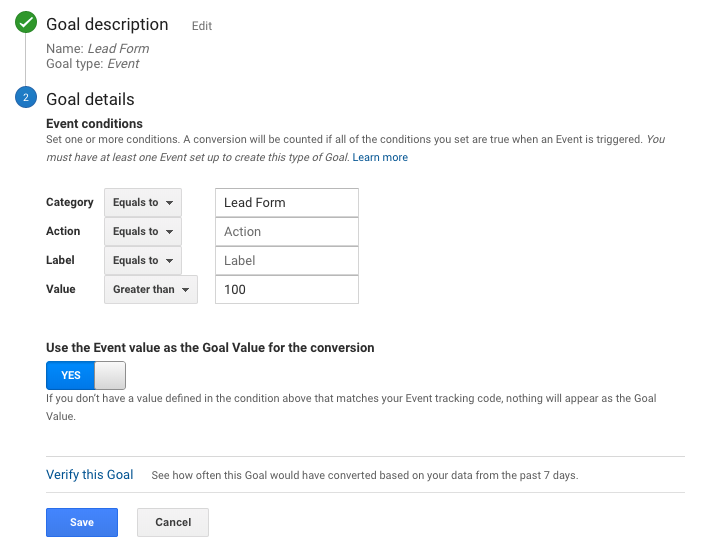
The way you track conversions will vary depending on the channel you’re serving ads on. For example, if you’re running Google Ads, you can enter the destination goal (the URL of the page that confirms a customer has converted, which is usually a thank you page or an order confirmation page) or set an “Event” that indicates a customer has converted.
That might be signing up for your newsletter, making it through to checkout, or contacting your customer support team. Every time a customer takes this action or lands on a certain page, Google will consider that a conversion.
5. Regularly Review Campaign Performance
Digital ads aren’t a set-it-and-forget-it activity — not if you want to get high returns, anyway. At first, there’s a good chance you’ll need to tweak your copy, titles, artwork, and audience to see which combinations get the best results.
It helps to check in and review how your campaigns are doing regularly. You can set aside a block of time every week (or month at the absolute least) where you can log in to your analytics tool and measure your results against your KPIs.
This will ensure you’re optimizing your budget and getting a good return on investment (ROI) on your ad spend, but it will also help you identify any issues before they become a problem.
6. Run Regular A/B Tests on Your Ads
Running A/B tests (or split-testing) on your ads will show you which variation of creatives, headlines, copy, landing pages, and targeting options perform best. For example, you might think that an illustrated graphic with a humorous headline will be your customers’ favorite, but actual testing might show that a video with a clear explanation performs better.
Don’t forget to test your landing pages too. They form an important part of the ad journey. If customers are clicking through but not converting, it can indicate a problem with your landing pages.
The best way to A/B test your ads is to swap out one element at a time. Hence, you know exactly what it is that’s making a difference — i.e., use the same headline, ad copy, landing page, and targeting options but change the accompanying visual.
Start Demonstrating High Returns on Your Ad Spend
Digital ads can be incredibly fruitful — there’s a reason they're one of the top retail trends. To start generating high returns (and be able to demonstrate those high returns), it’s important you set your ads up correctly and regularly monitor them.
Choose your KPIs, invest in a robust analytics tool, and carry out A/B testing to see which combinations of creative and copy perform best.

How Brands ‘Do’ Retail Media
For a deeper dive into digital ad spend in the retail media landscape, download the Digital Shelf Institute’s (DSI) latest report.
DOWNLOAD REPORT.svg)