

When debugging software, particularly if it's code you didn't write and aren't familiar with, one of the hardest parts can be just determining where to start. Without the right context, you can end up chasing red herrings all over before finally tracking down the underlying problem. Well-placed log messages can help provide that context, saving that time and frustration. In this post, we'll look at adapting a logging technique employed by many Node tools on the command line for use in an Ember.js app in the browser.
Seeing the light: Ember CLI's logging
A little while back I was looking to track down a performance issue in our Ember CLI build. We'd included a new addon that seemed to be pretty innocent, but somehow adding it had caused our styles to be reprocessed any time we made a change to the app code, and it wasn't at all clear why that was happening.
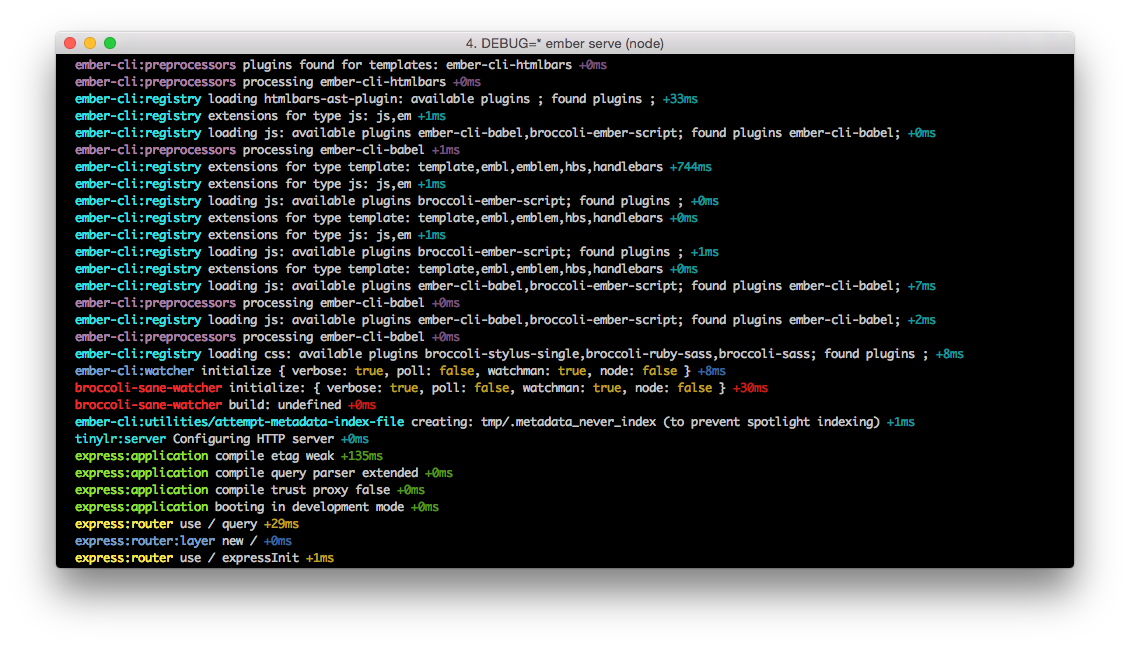
While looking through open issues in the CLI project to see if anyone else was running into the same trouble, I came across the recommendation to run the build using the DEBUG flag to enable logging for specific namespaces. Suddenly, I had a wealth of information at my fingertips, all broken out by what section of the application it was coming from, without ever having to set a breakpoint or manually tweak code.
 In the end, the performance problem came down to an issue within Ember CLI itself, but afterwards I was left really impressed with how easy the process had been. I'd narrowed the issue down to a specific part of the build before I ever cracked open the source and went code spelunking. I wanted to be able to replicate this experience during regular development: if the build tooling had this kind of logging, why not the application itself?
Bringing it to the Browser: ember-debug-logger
It turns out the library that Ember CLI uses also has a browser implementation. Because of how simple the CLI team has made it to spin out an addon, it's easy to wrap that library in a bit of Ember-oriented code and publish it for anybody to use, so that's exactly what we've done.
With ember-debug-logger, it's trivial to log debug messages from container-managed objects like routes and components, and the addon will automatically namespace the messages based on the object's key.

debug.enable('route:index');
You can also use globbing. Suppose you want info from any route as well as a particular service:
debug.enable('route:*, service:squeaky-wheel');
Or, if you want the full firehose:
debug.enable('*');
In Practice
We've already started using the addon in a few places to track invisible events (like analytics calls that are otherwise inert during development), and it's made it much easier to verify expected behavior. We expect to start using it more and more over time, and hope it proves useful for other people too.
Take a look at ember-debug-logger and let us know what you think! We'd love to get your feedback on the addon and see suggestions (or better yet, PRs) for improvements.